
Gold began 2021 on a high note, on Monday adding 2.3%. The precious metal escaped from the downstream channel due to the continued drop in the dollar.
Gold nominated in the US dollar, and therefore these assets have an inverse dependence. The attractiveness of the dollar as an investment tool depends on its profitability. The real yield, which represents the difference between the nominal yield of basic bonds and the level of inflation, fell in 2020 and is now -1.092% (for the minimum of last year).
The cost of gold increases and falls in the mirror reflection.
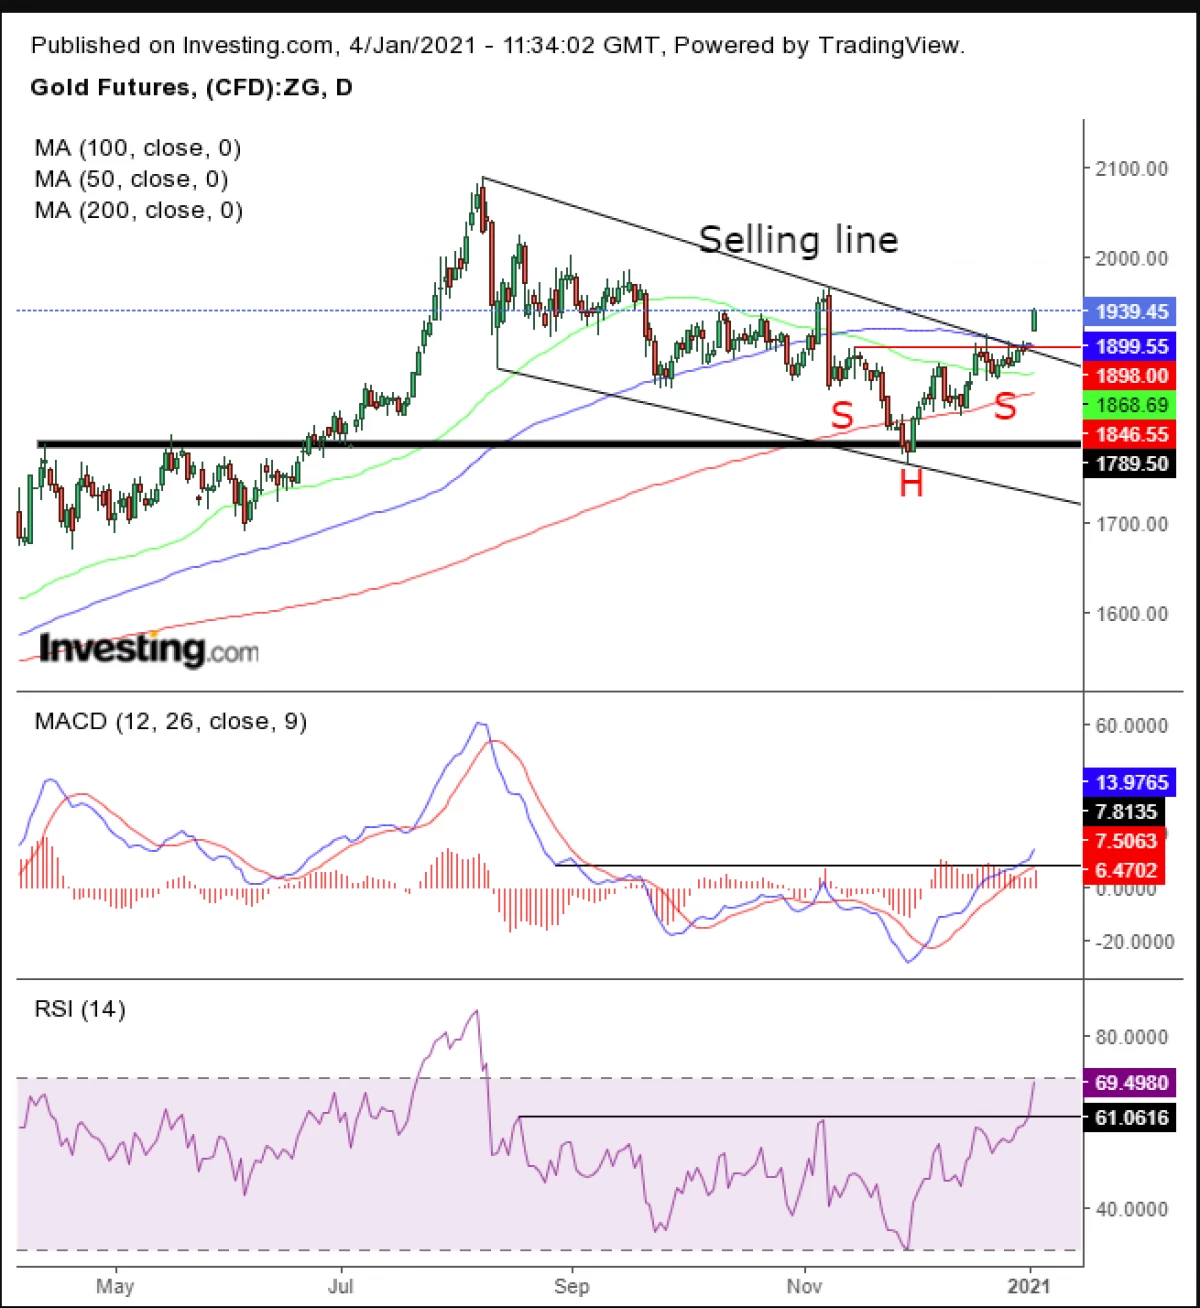
Since November, gold formed the "Head and Shoulders" model (H & S). Within its framework, the "bulls" were able to regroup and break the resistance of "bears".
Please note that H & S is precisely synchronized with a falling channel. Additional technical signals indicate a 100-period DMA 100 as a technical pressure center. The neck line intersects from the peak of the channel, and April-June resistance supports a downward range.
In this case, the MACD and RSI indicators beat off from the local bottom. The 50-period DMA began to bend upwards, moving away from 200 DMA.
Here is another indicator hinting at the growth of precious metal in the long run:
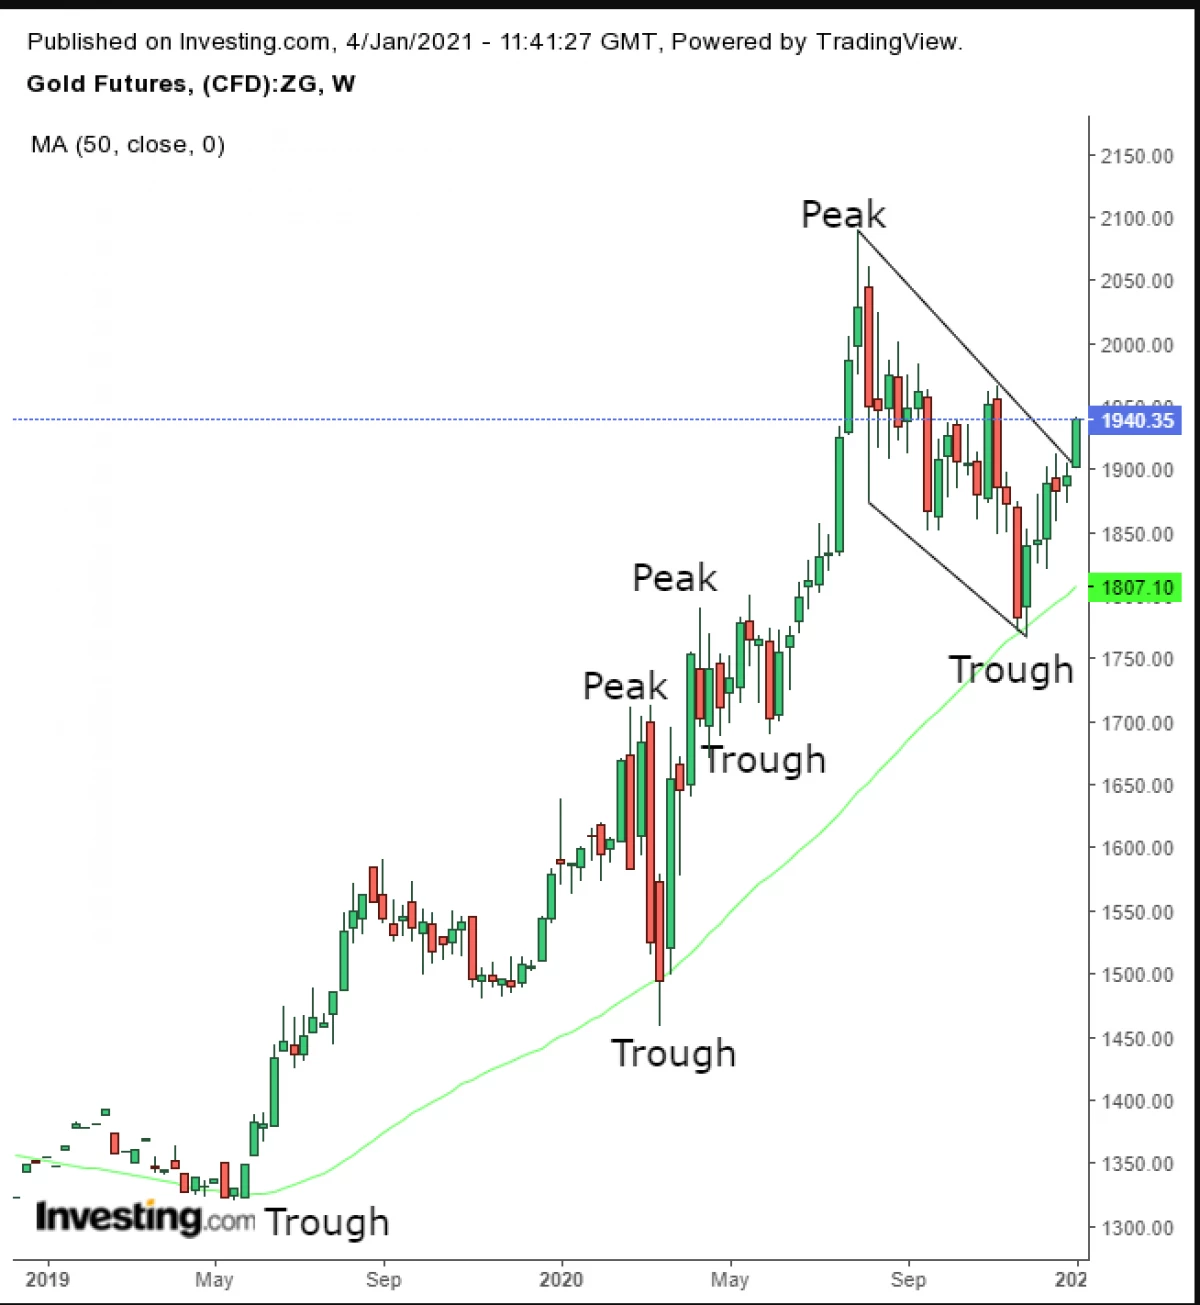
Pay attention to the 50-week moving average trajectory. It suggests the aspic nature of the long-term trend.
Trading strategies
Conservative traders for a long position need a new medium-term maximum of the peak of November 9, followed by rollback and testing of H & S, channel vertices and 100 DMAs.
Moderate traders will wait for either the achievements of the November maximum, followed by proof of his support, or roll back to $ 1900.
Aggressive traders can buy now. In this case, they will be in the scripts "chase per causing" and are subject to sudden correction risks. In addition, this approach makes it difficult to find a reasonable risk ratio and profits between the breakdown level and the resistance of the November maximum. Therefore, we call for patience.
Wait until the price reaches either support (for purchase), or resistance (if you want to risk and play against trend). In this case, the resistance breaks will lay the foundation for a long position.
Example of a short position
Login: $ 1960; Stop Loss: $ 1966; Risk: $ 6; Target: $ 1900; Profit: $ 60; Risk ratio to profits: 1:10.
An example of a long position
Login: $ 1910; Stop Loss: $ 1900; Risk: $ 10; Target: $ 1960; Profit: $ 50; Risk ratio to profits: 1: 5.