
Bitcoin (BTC) survived a powerful correction on February 22, tested at least $ 45,000. At the time of writing, the first cryptocurrency is trading in the area of $ 48 300
Despite a significant drop, correction, most likely, will be short-term, and soon we will see Bitcoin on new maxima.
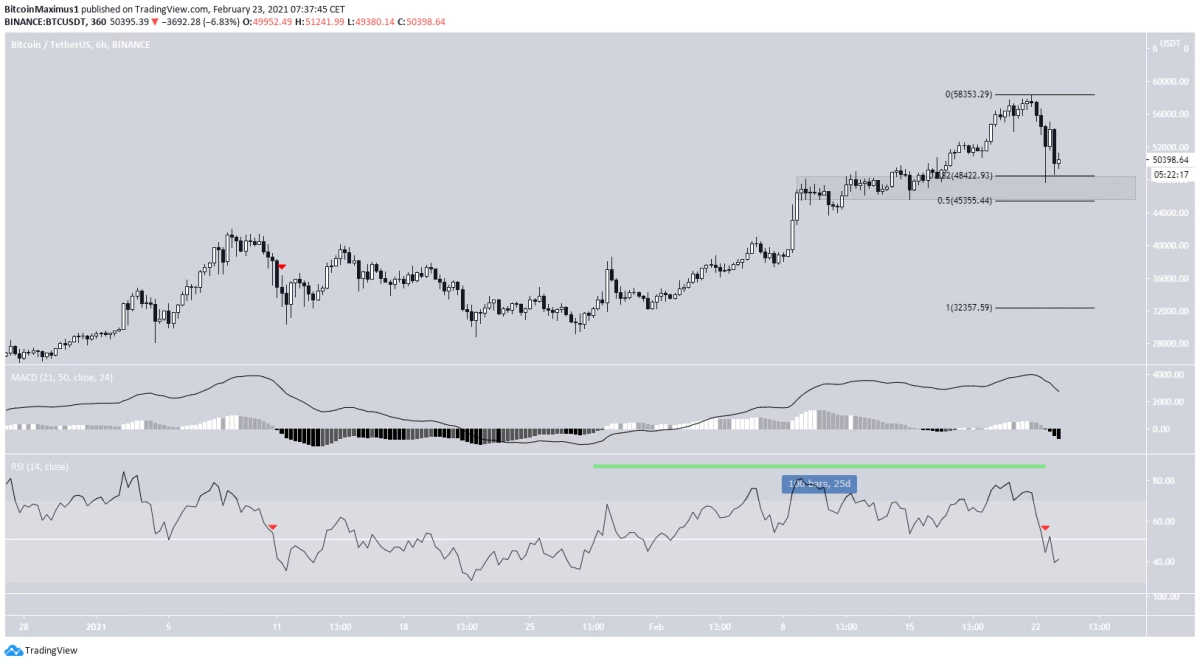
Bitcoin is trying to add support
Bitcoin came to the correction and at the auction on February 2 tested at least $ 45,000. However, buyers who helped price recover appeared in this area.Technical indicators indicate some weakening. In particular, MACD and RSI crossed the mark 70. However, these signals are not always enough to confirm the bearish reversal. Depending on the daytime closure price, it is likely that RSI will generate a hidden bullish divergence - a signal to continue the trend.
Further dynamics
The six-hour schedule indicates that BTC tested Fibonacci correction level 0.382 at $ 48 422. It follows $ 4555 (0.5 of Fibonacci correction).
RSI 25 days kept above the mark of 50 and finally descended below. It may be a sign of a trend reversal, similar to what occurred on January 10, 2021.
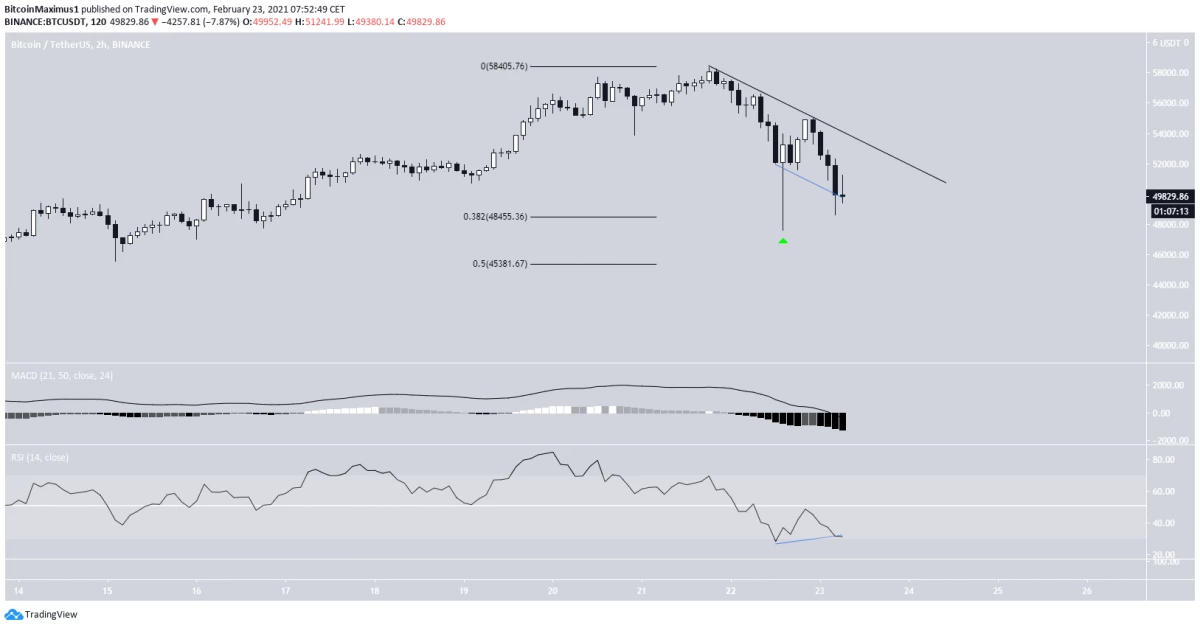
A two-hour schedule shows some signs of bovine reversal in the form of bull divergence on RSI and a very long bullish hammer (green arrow).
While the BTC fails to break through the short-term downward line of resistance, we cannot consider the correction completed.
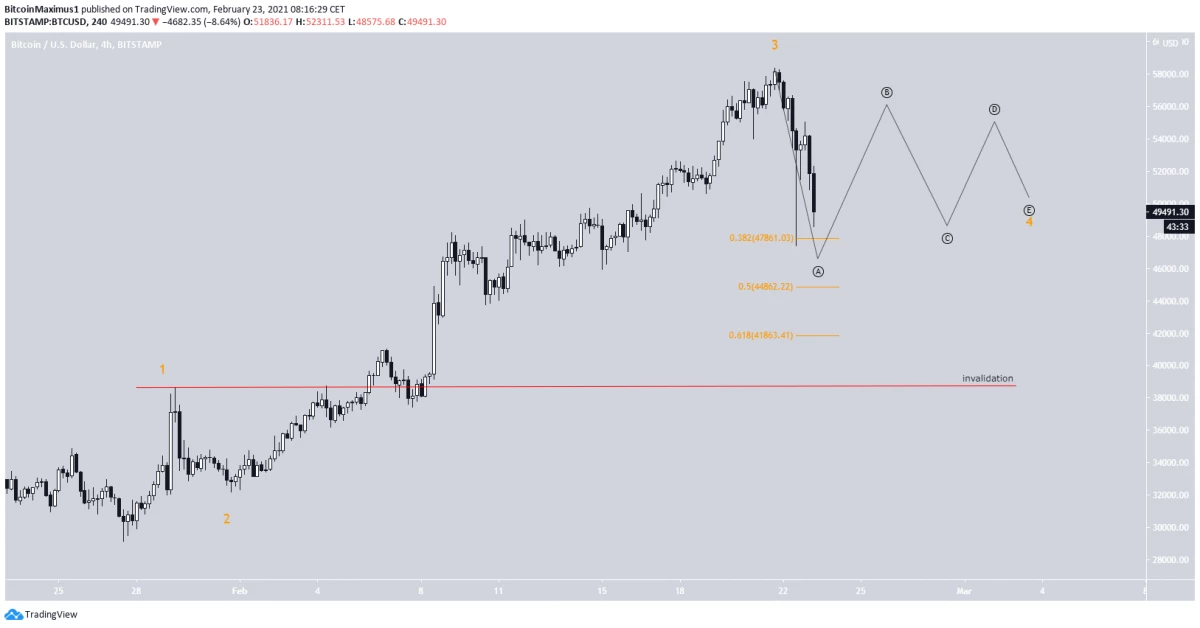
Wave analysis BTC.
The most likely wave count assumes that BTC is in the fourth wave of a bovine impulse (shown by orange), which began from the minima on January 28 at the level of $ 29,000. When the wave formation is over, Bitcoin will rush to $ 60,000.
The most likely calculation of the waves suggests that BTC has completed or approaches the completion of the fauna A. We come to this conclusion because prices have already tested support for 0.382 Fibonacci.
Most likely, BTC can once again test 0.5 fibonacci, but most likely, first adjusted and completes the front of V.
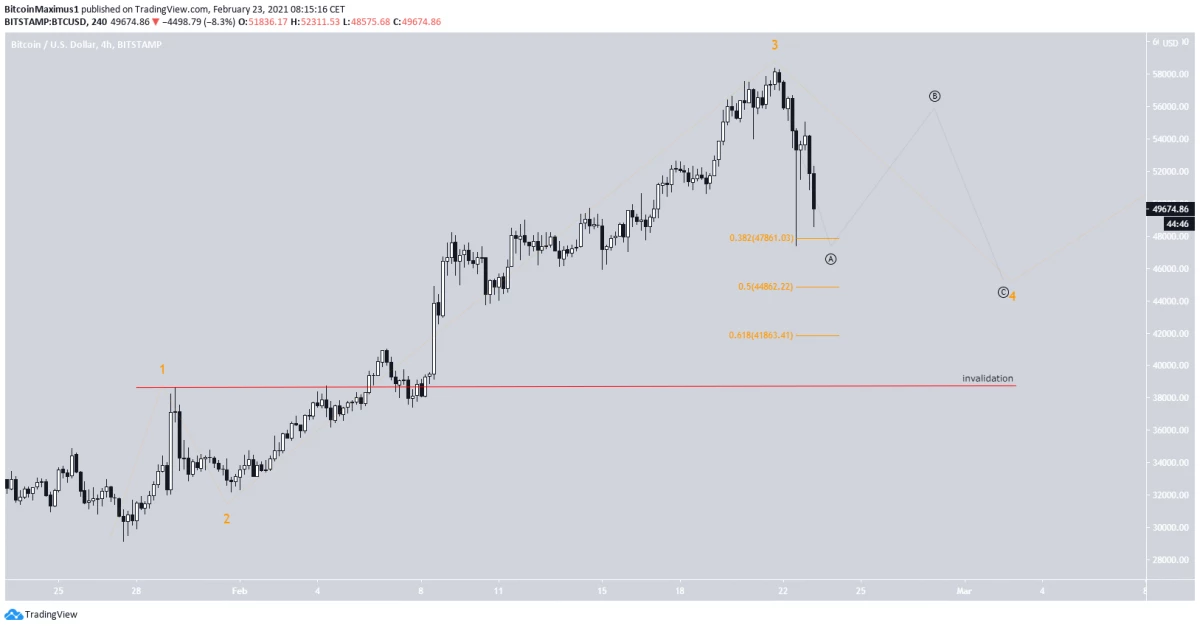
With a more optimistic scenario, it will turn into a triangle of the fourth wave. In this case, the current minimum will actually become the lowest price achieved.
However, it is currently difficult to predict the further nature of the correction.
conclusions
Despite the continuing fall, Bitcoin fasses support between Fibonacci correction support levels of 0.382 and 0.5. Then will start recovery.
It is likely that BTC still have to go up to a local maximum.
Here you can read the previous technical analysis on Bitcoin (BTC).
The POST Bitcoin fell below 50,000 dollars. We tell where the Appeared First On Beincrypto.