

Just three years ago, world GDP grew by 3% year on year, but copper prices decreased by more than 20%. Copper is often called "Doctor Copper" for the fact that in the nature of the demand for this metal you can diagnose any "diseases" of the economy. But then there was a disease of the inconsistency between copper and the economy.
Now copper prices are held close to record values, while the global economy seeks to free themselves from the consequences of coronavirus. The inconsistency is still preserved.
But this time the markets are rejoicing due to the forecast that the world will restore from the pandemic faster. Thus, "Doctor Copper" justifies its ability to predict the further development of the economy.
On Monday, for the first time in the last nine years, prices for copper futures with delivery in three months at the London Metal Exchange exceeded $ 9,000 per metric ton, heading towards the historical maximum of $ 9945, recorded in April 2011. The current increase in prices is related to the fact that investors believe that the problems with the supply of copper will be aggravated against the background of the restoration of the world from a pandemic.
At the subdivision of the New York Commodity Exchange COMEX May futures for the supply of copper reached $ 4.22 per pound. This is the highest value after the high of August 2011, when copper cost $ 4.50. The current rise in price of copper is associated with hopes for the fact that a package of financial stimulation measures worth $ 1.9 trillion of President Joseph Biden will ensure recovery (reflation) of the American economy.
Reflation, inflation or stagnation?
Reflation is a fiscal or monetary policy aimed at increasing production, stimulating costs and overcoming the consequences of deflation. Usually reflation occurs after a period of economic instability or recession.At times, reflation is also called the first phase of the economic recovery after its reduction. At such times, the dollar usually decreases, provoking a sharp increase in commodity prices, which is known under the term "reflation trade".
Some analysts predict that the refilling of the American economy would be nothing more than an old good inflation that will again include "in fashion" after a year of despondency. Some economists even predict that stagflation will arise - a combination of stable high inflation with high unemployment and sluggish demand.
In any case, the forecasts say that the demand for copper will take off to heaven.
Copper for $ 10,000 on the London Metal Exchange and $ 5 on Comex
Specialist Citigroup Max Leighton, Head of the Raw Market Analysis Department in the EMEA region, on Monday, in an interview with Bloomberg, he said that the list of "bullish" factors for copper prices are extremely long:
"In the next months, many of the bullish factors will truly play. Therefore, we predict that sooner or later prices for copper will reach $ 10,000. "
Graphs provided SK Dixit Charting
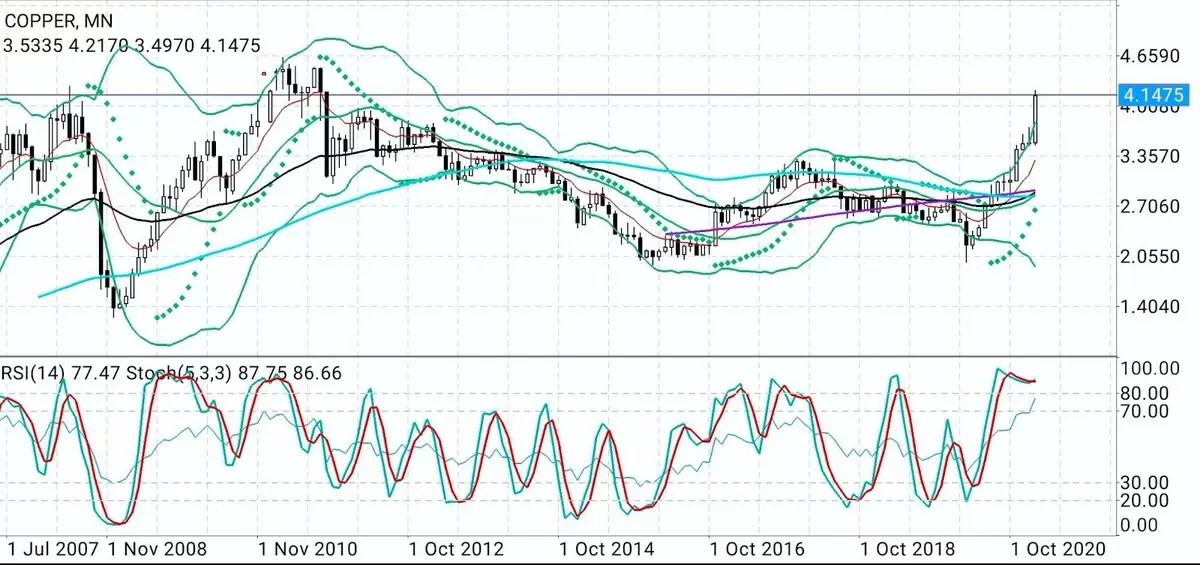
According to Sunil Kumar Dixit, the SK Dixit Charting analyst based in the Indian Calcutta, on the subdivision of the New York Commodity Exchange COMEX Copper will rise in price to $ 5 per ounce, beats a record value of $ 4,625, recorded in August 2011. Dixit believes:
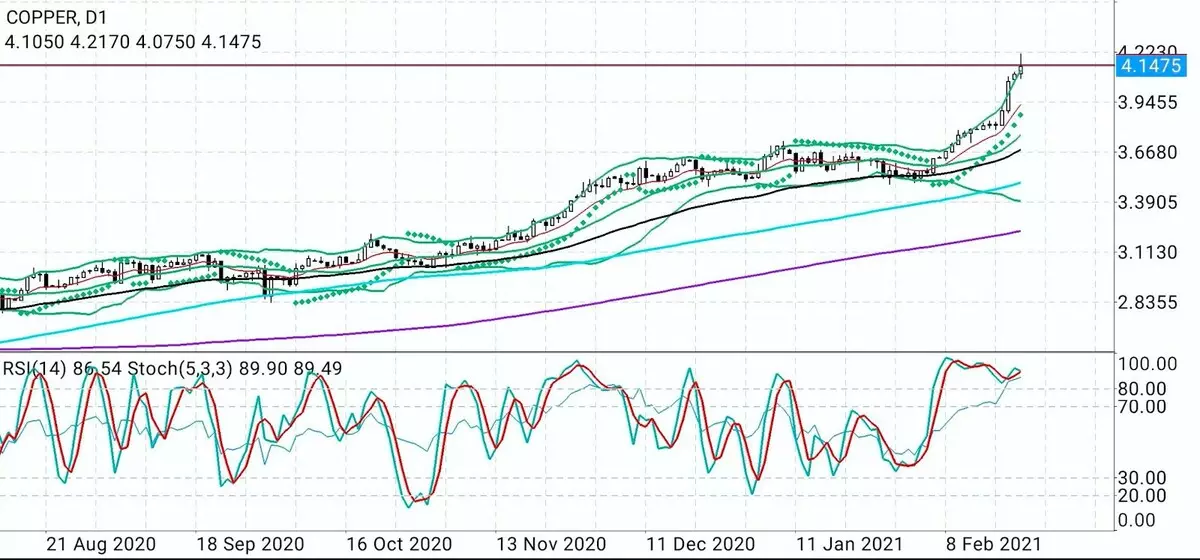
"On Comex prices for copper passed the resistance levels of $ 3.30, $ 3.80 and $ 4,10 as a hot knife passes through the oil. The current dynamics suggests that copper is ready to overcome the maximum of 2011, fixed at $ 4.63. If this happens, which is very likely, "bulls" may not calm down, and then copper will be copper on the agenda. "
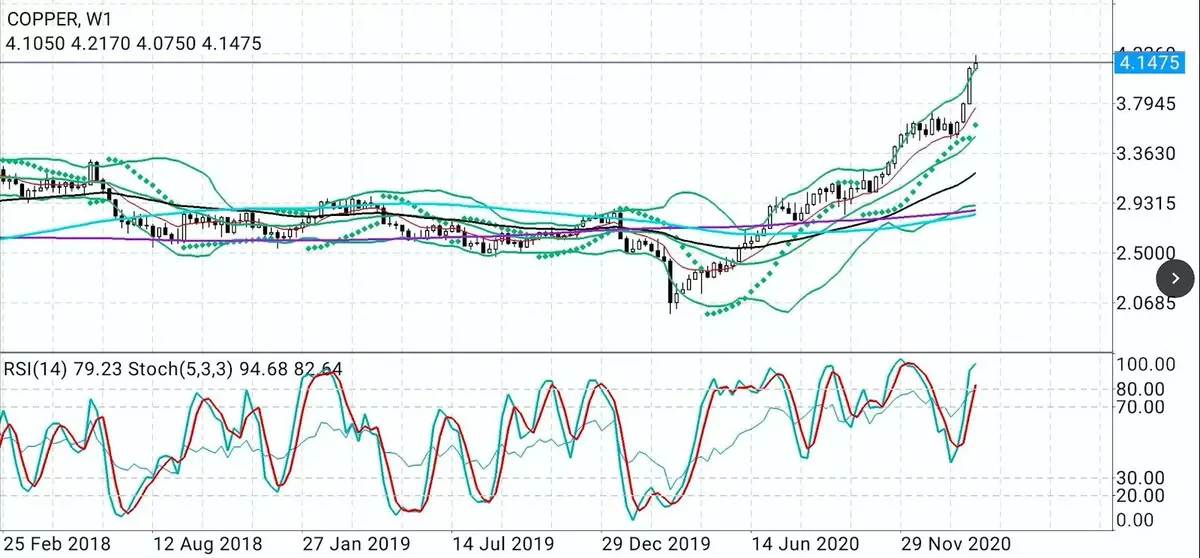
As for the technical indicators on copper graphics on COMEX, the relative force index (RSI) indicates up for daytime, weekly and monthly graphs, most of the graphs of moving averages are also growing, giving, according to DiCita, serious grounds for continuing a bull trend.
However, he warns that the passing wind for copper may change, although not long:
"On the other hand, the completion of day and weekly trades below $ 4.07 should be considered as the first sign of the start of price distribution and correction, which will lead to the fact that copper prices will decrease by the 10-week and 50-week exponential moving average at $ 3 levels, 76 and $ 3.68, respectively. "
A wave of demand that raises prices for most commodities
But prices are growing not only for copper. Prices are almost on all commodities - from oil to gold, from silver to corn - rose a tidal wave caused by a flow of cheap money. Investors are looking for high profits while central banks of the whole world retain record low interest rates in order to accelerate the recovery from COVID-19.In the case of copper, the rally continues for a long time.
Copper is often considered as an indicator of the situation in the global economy. And this metal is becoming more expensive almost without stopping for a year mostly thanks to the main consumer - China. This country began to recover from Lokdaunov COVID-19 before the rest of the world.
However, over the past decade, the discrepancy between copper prices and economic growth turned out to be so huge that for the uninitiated simply mention of the "Doctor Copper" could reasonably call the question: "Doctor who?"
Despite the financial crisis of 2008-2009, world GDP has increased. The cumulative GDP growth for the period 2000-2009 was 29%, which corresponds to an annual increase by 2.9%.
If you compare it with copper prices, then in January 2000, it started at COMEX with a value of $ 0.86 per pound and finished $ 3.33 in December 2009. This is a terrific increase in price by 287%. Obviously, copper at this time did not reflect the situation in the economy, she was out of economic growth.
Again from dirt in the prince?
The mystery of copper in 2000-2009 was not solved for the next ten years.
GDP growth in the next ten years has not changed practically, accelerating to the aggregate value of 30% for the period from 2010 to 2019 (an average of 3% annually). However, copper went to another way.
On Comex, metal prices started with $ 3.33 per pound in January 2010 and finished at a value of $ 2.83 per pound in December 2019. Thus, the cost of copper during this period decreased by 15%.
Analysts studying prices for this decade believe that copper prices are often restrained due to the concerns of a slowdown in economic growth, which never comes. Also, the demand and price has influenced the intensive trading war of the Trump administration with China, which is the largest importer of this metal in the world.
In any case, in two decades, copper, as the main industrial metal of the world, sank out of the princes in the dirt.
Will she go back the way back?
Disclaimer. Bararan Krisnan cites the opinions of other analysts on Investing.com to provide a versatile market analysis.
Read Original Articles on: Investing.com