
First of all, it is not necessary to pay attention to the influence of the February Employment Report in the USA for Gold Prices. Forget about it, because, most likely, this is an impact, as the head of the Fed Jerome Powell says, will be transient.
I use this expression, as Powell uses them to express their carelessness regarding the increase in prices in the economy, which is still experiencing the consequences of the Pandemic COVID-19.
On Thursday, at an event organized by Wall Street Journal, the head of the Fed said that there is a difference between a single case of price increases and stable inflation. He then added that the transient acceleration of inflation would not affect it in the long run.
Powell's opinion on the short-term inflation (as well as his conviction that the United States will not return to the situation of maximum employment this year or in the near future) led to an increase in the yield of US government bonds, in particular, the profitability of "reference" 10-year-old bonds. Simultaneously rose and dollar.
At the same time, stock prices on Wall Street decreased due to investors' concerns about the fact that expensive shares of technological companies such as Apple (NASDAQ: AAPL), Microsoft (NASDAQ: MSFT) and Amazon (NASDAQ: AMZN) are overvalued .
Gold prices that slowly melted the last two weeks, fell even lower on the background of the collapse in the stock market, despite the fact that gold is considered tool for hedging from inflation. US President Joseph Bayden on the allocation of a package of assistance to the economy in the amount of $ 1.9 trillion is practically guaranteed to be approved by the Senate. As a result, the US budget deficit will increase, and the ratio of external debt to GDP will increase. Both of these factors are favorable for gold prices, but both were ignored.
The reason for this is as follows: Powell eliminated the possibility that the US Central Bank under his leadership will immediately stop the purchase of government bonds to stop the growth of their profitability. Just Powell believes that the inflation pressure arising in the United States this year will be transient. From a technical point of view, it is favorable for gold prices. The term "transient" became one of the favorites at the head of the Fed in the Pandemic Epoch. Only last month he took advantage of them three times to say that it would not take action in response to temporary economic factors.
The influence of data on gold employment will also be transient
Following the same logic, I ask you not to take into account the Friday of the February Employment Report in the United States, if you want to determine the direction (or, more importantly, the "bottom") course of gold prices, which is now traded at $ 1600-1700 per ounce. The consequences of this report would say Powell, will be only transient in the general background of the economy, which still seeks to return to normal employment. In addition, there are still many other factors that will be defining for the forecast on risky and protective assets (if only gold can still be considered a protective asset, which I doubted a month ago).
Apparently, the number of jobs in the United States in February will grow, which is a negative factor for gold prices. Nevertheless, we should not forget that jobs are the harder to create in the economy, and the latter often slows down as a result of reducing jobs. Be that as it may, in December, the number of jobs in the United States decreased by 227 thousand, and in January increased by 49 thousand until this indicator becomes more stable, it will not be a reliable reference for gold prices.
Since there are no really reliable fundamental factors for predicting gold prices, then a technical analysis will help with the forecast?
Many forecasters, including me, there are various points of view on the yellow metal (I will save your dessert).
Let's start with the opinion of Sunila Kumara DiCita, the analyst of SK Dixit Charting. Hedge funds use spot prices for gold instead of futures prices as a guide to determine the further course dynamics. Dixit believes that in the event of a market reversal in the direction of growth, the spot price of gold will reach $ 1843, and in the case of its fall drops to $ 1460.
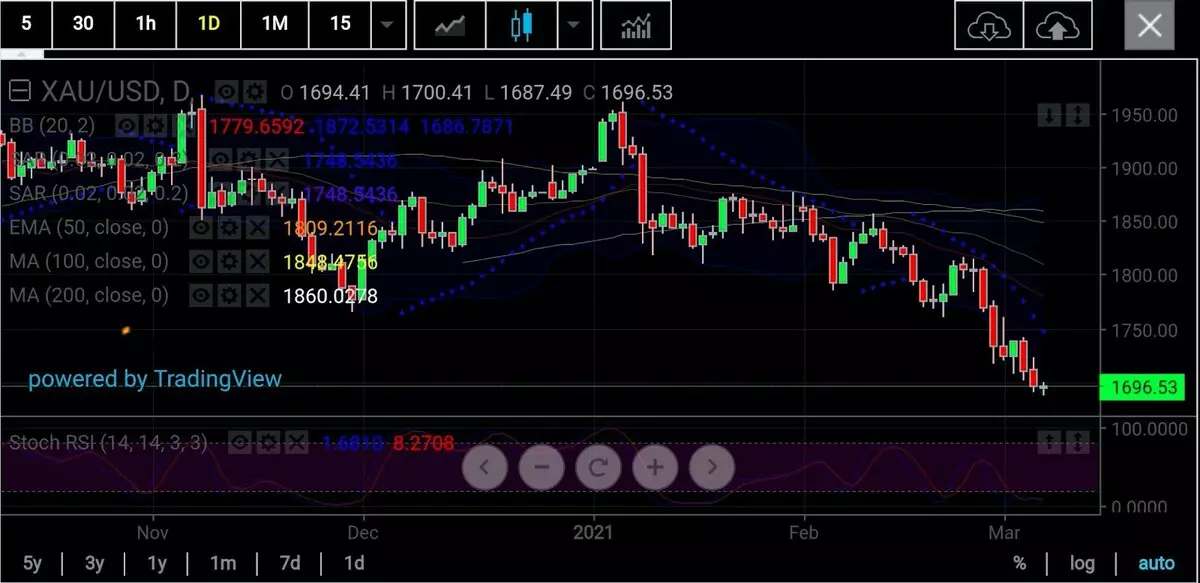
Graphs provided SK Dixit Charting
Gold put on her knees
According to DiCita, gold turned out to be on his knees and trembles:
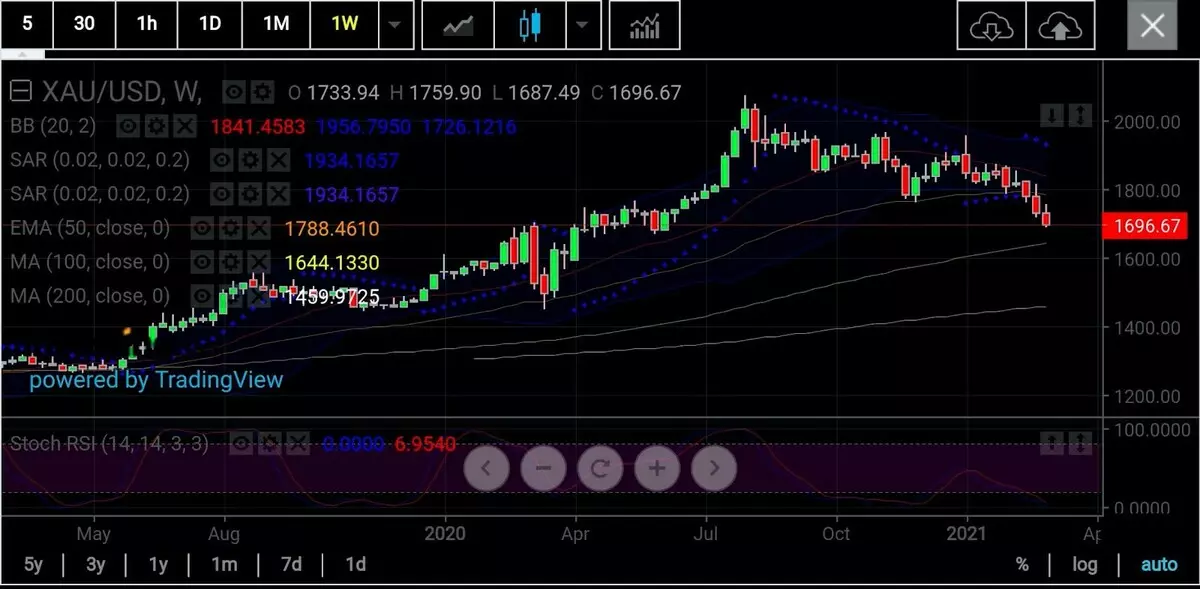
"We have not reached the bottom. The only reliable level of support is the 100-day moving average for weekly schedules, which is located at $ 1646. This support is enough to increase gold prices at $ 100, $ 150 and even $ 200.
Reference rebound from the critical level of support $ 1646 is able to return gold prices to testing a 50-week exponential moving average at a position of $ 1790 and even a 20-week moving average at the value of $ 1843. "
However, according to DiCita, only approximation to the level above $ 1868 can become a signal about a reliable reversal of the gold market up, meaning that prices pushed out from the bottom.
Otherwise, there are risks of new oscillations, first for "bulls", and then for "bears":
"Judging by the prevailing and comprehensive decrease in gold prices," bearish "trend can reach the value of a 50-month exponential moving average at a position of $ 1530, and then the prices for yellow metal will reach a 200-week moving average at the value of $ 1460. If this happens, double bottom will be formed. This double bottom will lead to an explosive growth that will provoke the next rally to alarming maxima. "
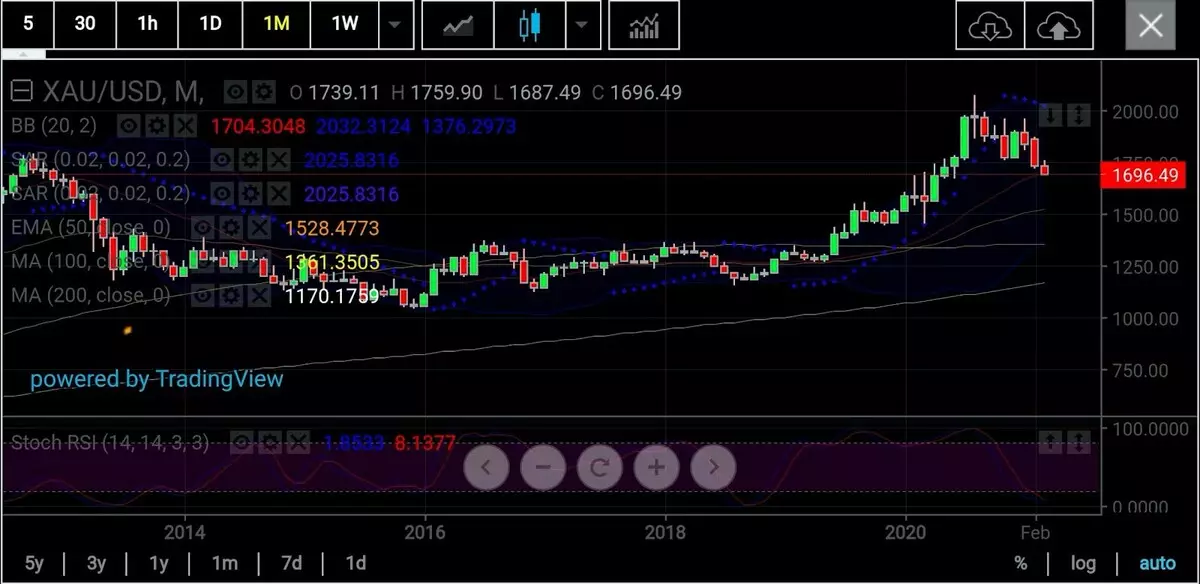
Despite any restoration from such values, you need to remember one thing - the fall in the price of gold up to $ 1460 almost completely levels all the profits achieved on the wave of fears about COVID-19. In March 2020, the spot prices for gold fell to $ 1451.50 before starting the epic rally for four and a half months, as a result of which gold prices increased by $ 600, and a historical maximum of $ 2073.41 was recorded in August.
According to the analyst FXStreet of the dummy Mehta, gold prices are tested by the lower border of the downward wedge, the support point of which is at the value of $ 1687.
In its mailing to clients, twin reports:
"To confirm the breakdown, it is required that the four hour candle closes below this value. It will open the way to a decline to the minimum of June 2020, recorded at position $ 1671. "
Jeffrey Holly, the leading market analyst of the Asia-Pacific division of Oanda, notes that gold prices threatenly balance over the level of Fibonacci support 61.80%, at position $ 1689 per ounce:
"If at the end of the trading of the last trading session of the week, gold prices will devote below this level, it will become an important technical signal for the" bearish "trend. In this case, the basis will appear for the further decline in gold prices next week to the level of $ 1600. "
In published on Thursday, the "review of customer moods" of the IG group said that the coefficient of net long positions of gold traders grew by 5.85 (85.41% of long positions). Typically, this value speaks in favor of the "bearish" trend.
The IG review says:
"As a rule, our opinion is the opposite of the opinion of the majority, and the fact that traders choose long positions, suggests that gold prices can continue to decline. Traders often choose long positions than yesterday and last week. Therefore, the combination of current positions and recent changes gives us the opportunity to talk about the strong opposite trend in price reduction in terms of sublimation. "
Technical analysis - "actively sell"
From my point of view, there is nothing surprising that Investing.com's technical forecast for the April Futures for Gold on the division of the New York Commodity Exchange Comex sounds like "actively selling".
Prices for gold contracts must continue the "bearish" trend. The appearance of support for three Fibonacci levels is predicted: $ 1690.31, $ 1682.89 and $ 1669.30.
In the event of a market turning towards growth, three levels of resistance in Fibonacci levels are predicted: $ 1716.29, $ 1724.31 and $ 1737.30.
In any case, the point of the reversal is at the value of $ 1703.30
As with other technical forecasts, we urge you to follow our inner aspirations, but to check them with the fundamental principles of trading and, if necessary, make adjustments.
Disclaimer. Bararan Krisnan gives the opinions of other analysts to submit a versatile market analysis. It is not the holder of the raw materials and securities reviewed in the article.
Read Original Articles on: Investing.com