
According to Dr. Muriel Jean-Jacques, Medicine Associate Professor of the North-West University, a newly approved by the US Vaccine, Johnson & Johnson (NYSE: JNJ), has two properties that radically change the rules of the game.
First, it is introduced by one dose, unlike the already available MODERNA preparations (NASDAQ: MRNA) and PFizer (NYSE: PFE) / Biontech (NASDAQ: BNTX). In addition, JNJ vaccine does not require ultra-low temperatures and can be distributed in conventional freezers, which facilitates vaccination both in remote and urban areas around the world.
The combination of these factors strengthens the fundamental picture of the company. The manufacturer of drugs plans to ship 4 million doses this week, and by June the figure should reach 100 million.
But there are other reasons why JNJ vaccine is able to launch its shares "into space". It turned out that it is effective against new strains (for example, South African), and with an effectiveness of 64% prevents moderate and severe consequences. In addition, the vaccination by 85% protects against severe diseases and reduces lethal outcomes by 100%. According to the results of additional studies, the effectiveness in preventing moderate and severe consequences was 72%.
It is also worth noting that the successes of this vaccine coincided with the formation of a bullish technical picture on J & J shares.
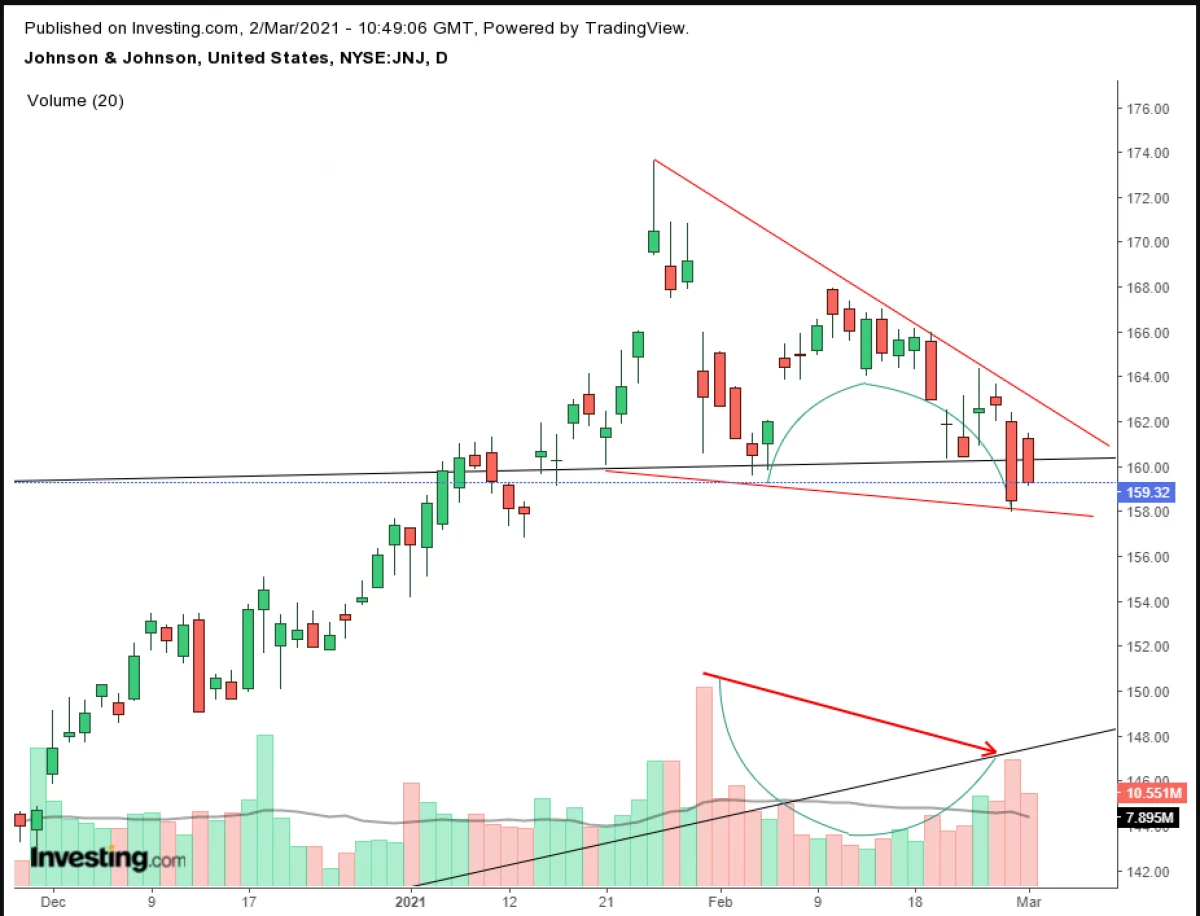
Shares are traded within the framework of the descending wedge, and its upper boundary decreases faster than the lower. The model shows that sellers agree to sell at increasing prices, and buyers support the market by their demand.
If a JNJ fall is expected, then why "bulls" are ready to absorb the offer? If sellers constantly go on a compromise regarding the price, then why buyers are willing to pay the same price, and not wait for deeper drawdown?
It becomes an obvious difference in market dynamics. Why did it happen? We believe that the case is in the time framework.
Shares took off by 30% in less than 3 months (from the lows of October 30 to record highs on January 28). Johnson & Johnson is not such an attractive company as Tesla (NASDAQ: TSLA) and Apple (NASDAQ: AAPL), which are constantly gaining momentum and inspire young traders. The shareholders of traditional blue chips are usually pensioners focusing on stable dividends and low asset volatility.
Lucky investors who bought shares to the rally, decide to fix profits. They sell paper, putting pressure on the price. Buyers, however, did not invested during this movement, apparently considering the decline of 9% as a fall in buying demand.
Please note that the trading volume decreased as they roll back from a record maximum, which indicates that this movement is not part of the trend. Also note that the volume mirror reflects the price dynamics. This once again demonstrates that the impulse is directed upwards.
Finally, it is important to note the location of the falling wedge on the chart.
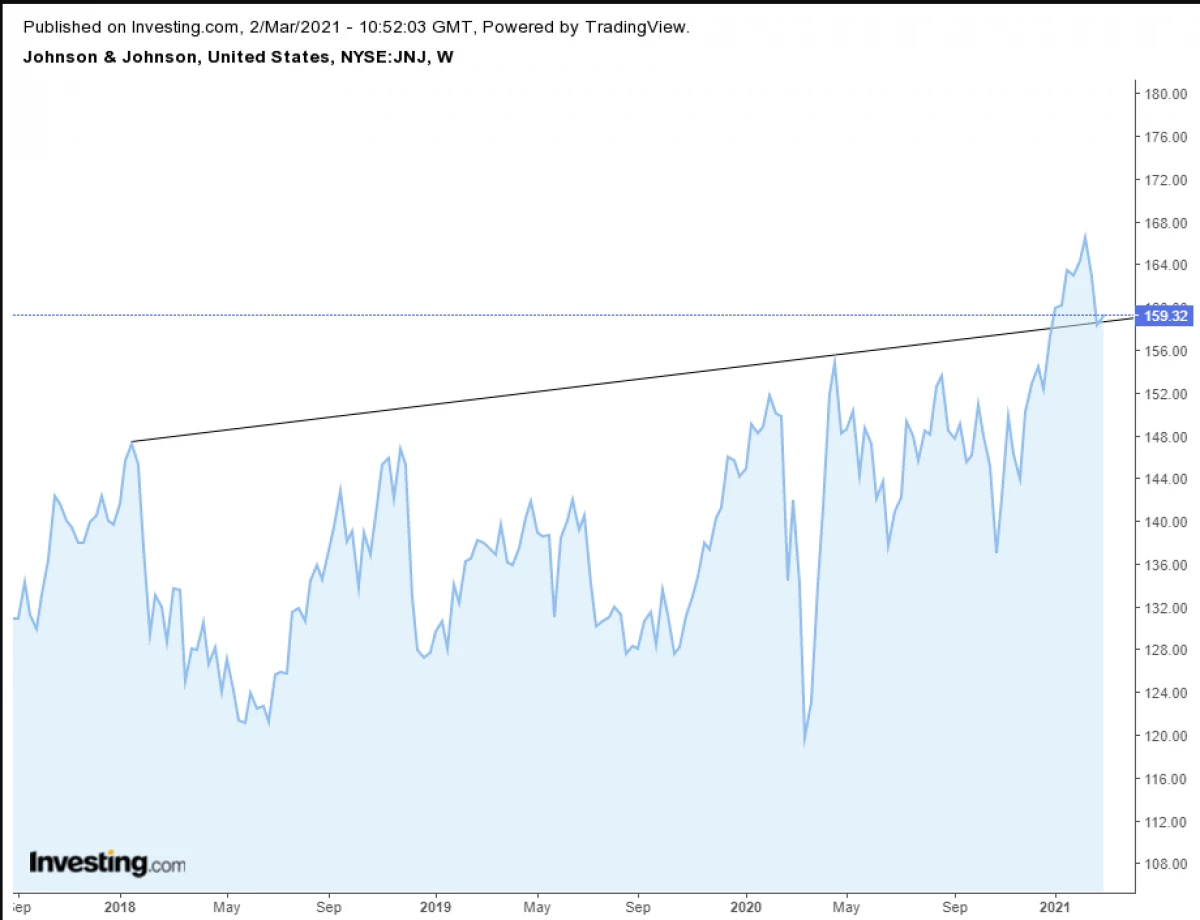
The fall followed the breakdown of the "ceiling", which limited the range of trading from January 15, 2018. The market is inclined to return to the punched levels and re-test them, checking whether resistance has turned into support. The speaker can be explained by fixing profits, i.e. Combination of short and long positions. Please note that the price recently overcame the long-term trend line.
It is also worth noting that the wedge is not yet completed. Ascending breaks will demonstrate the absorption of all available offers and the readiness of buyers to raise prices in search of new vendors, which will launch a chain reaction.
Trading strategies
Conservative traders should be waiting for the formation of a new maximum, and then buy on drawdown to a new level of support.
Moderate traders will buy after the price will overcome the peak of February 10 at $ 168; Potential rollback will allow you to minimize stop loss.
Aggressive traders can open long positions after the price tries the maximum of February 24 at $ 164.39; This scenario requires particularly careful compliance with the trading plan.
An example of a position
- Login: $ 162;
- Stop Loss: $ 160;
- Risk: $ 2;
- Target: $ 168;
- Profit: $ 6;
- Risk ratio to profits: 1: 3.
Author's note: This is nothing more than an example, which reflects one of the possible ways of trading in this particular situation. At the same time, even the correct interpretation of market dynamics does not guarantee the success of the position. We do not know how events will develop further, but the study of Thomas Bulkovski from 2000 has shown that 92% of descending wedges are completed by breaking up. Thus, trading on a clear plan will help you to stay on the "right side" of statistics. Your budgetary and temporal restrictions can affect the results of the transaction, as well as temperament. Learn to adapt the position to specific circumstances, and as long as then use small amounts to avoid large losses. Good luck!
Read Original Articles on: Investing.com