
Last week, the US monetary market remained without significant changes - everything is in the balance sheet. From the week to week, the mass of money in circulation is growing, which historically leads to an increase in food inflation, the occurrence of which members of the Fed are neutrally responded. But it is good to talk about inflation when it is not: so, according to the result of January, prices remained without significant changes; But how the rhetoric will change in the spring, when a seasonal increase in demand will be left on a low base of 2020 - the question remains open.
About this and many other things in this article.
The Balance of the Fed last week grew by $ 32 billion - this time the reason for the growth was the ransom of Trezeris.
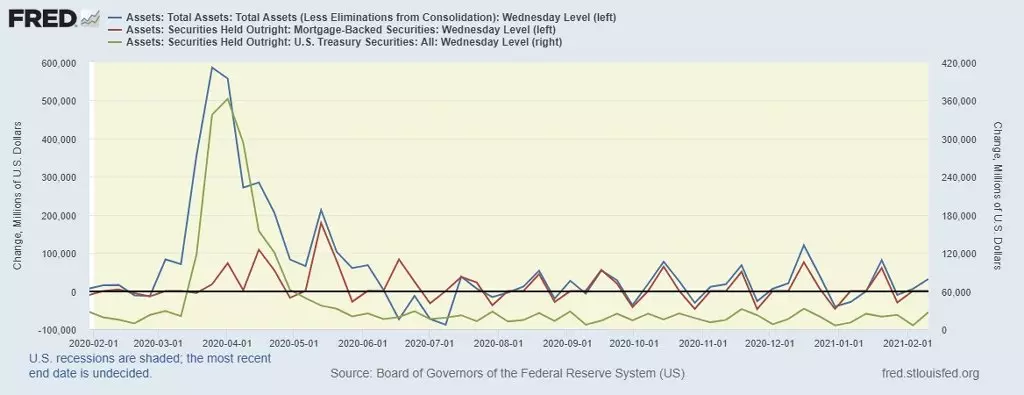
Blue line - Balance of the Fed from the week to the week.
Red line - the dynamics of the balance of securities provided by the mortgage.
Green line - the balance of treasury bonds on the Fed account, also from the week to week.
As we can see, last week both indicators grew and were higher than zero, but these processes are cyclical, and it can be expected to reduce the indicators in the context of the pair of weeks.
Next, we turn to the absorption indicators (absorption) of dollar liquidity.
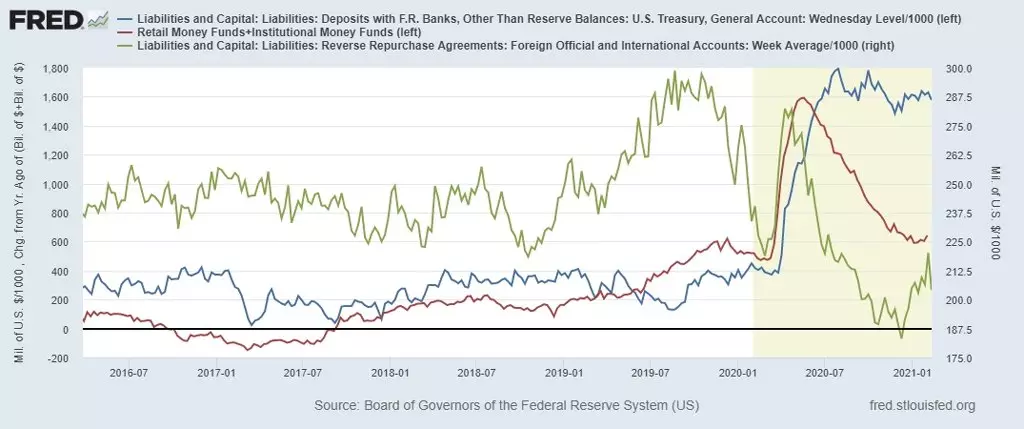
Blue line - US Treasury account in the FRB. At the current week, the bill has decreased by $ 53 billion. This indicator moves to the Wide with its historical maxima, which makes it possible to sign a new package, since part of the funds are available for distribution.
The red line is investments in mutual funds investing in the money market. The indicator is trying to turn around, and this at least means that the outflow from the mutual funds of the money market has stopped.
Green line - day repo for non-residents. Last week, the figure declined sharply, i.e., the demand for the dollar in the international market has declined, which puts pressure on the US dollar.
Also last week there was an overviewing of deposits to demand and urgent deposits.
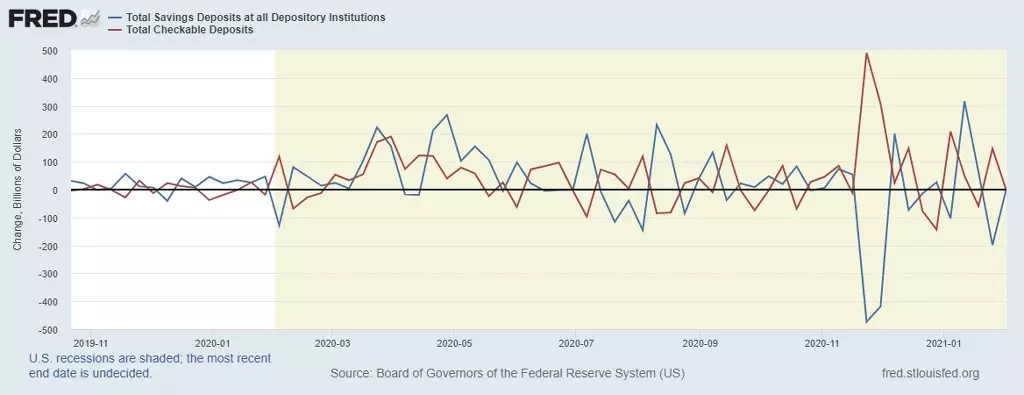
The blue line is the dynamics of exponential deposits (savings) from the week to the week.
The red line is the dynamics of the deposit of deposits (settlement accounts) from the week to the week.
As we can see, last week the indicators agreed in the zero point, which did not at all affect the monetary aggregates M1 and M2.
As a result, the money multiplier at the week remained flat in his minima:
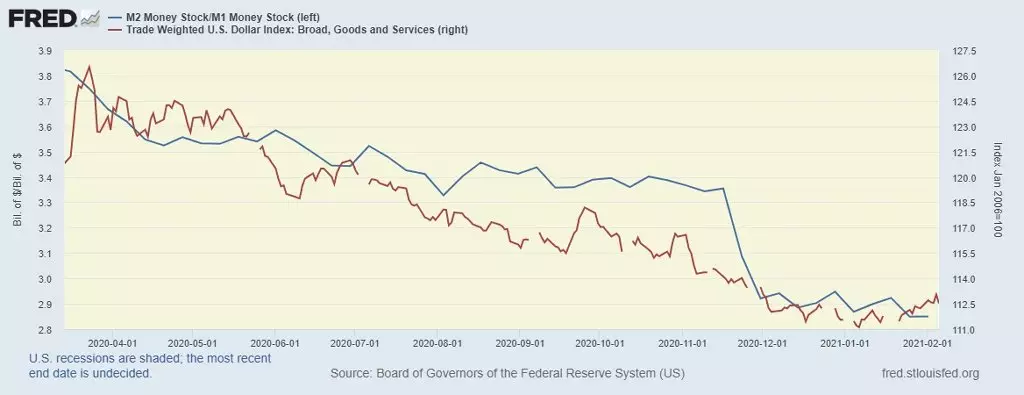
The blue line is a cash multiplier; We see that the indicator remains at minimal.
The red line is a trading and weighted dollar index.
Week in this area passed quite inexpressively.
The most interesting thing is: it is the cash balances that circulate on their hands continue to grow, and this is clearly threatened by the growth of inflation of demand at the time of opening the economy.
On the chart below - Illustration to this background:
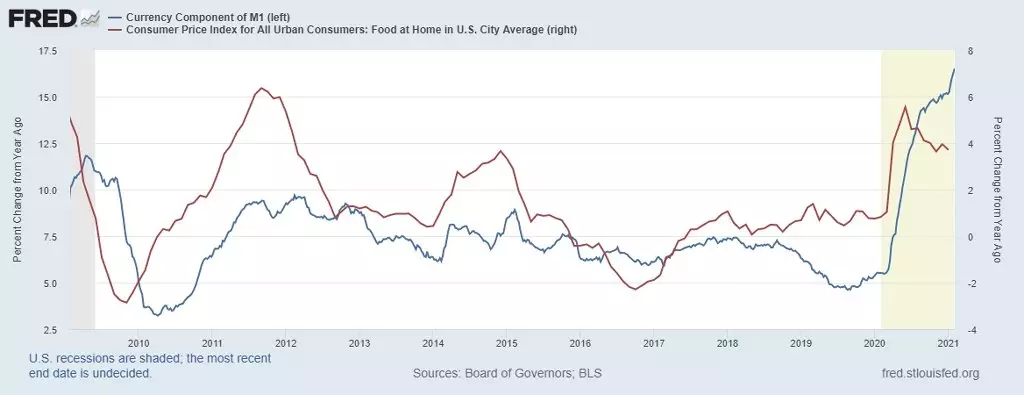
The blue line is the annual dynamics of money in circulation outside the treasury and the federal reserve system, that is, cash.
Red line - Food inflation, which has been locally slightly slightly, but remains high.
Over the past decade, the following pattern is observed: the more money in circulation, the higher the food inflation; Thus, in the spring, you can expect a new jump price.
And now - by tradition - we turn to the review of rates differentials:
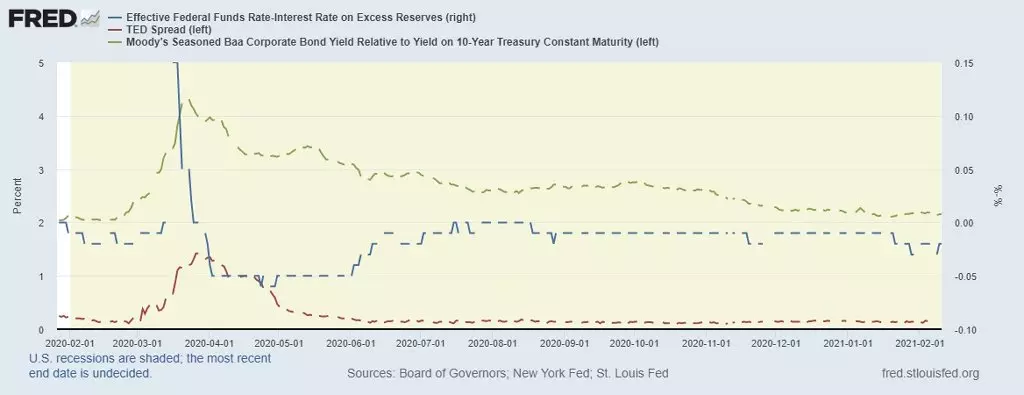
The blue line is the most important, in my opinion, the differential in the rates market: this is the difference between accounting and market rates; This will, this difference is complied, but at lower levels.
The red line is a ted spread, which reflects the demand for liquidity in the international market in London (LIBOR). The indicator makes growth attempts, while very modest.
Green line is the difference between the profitability of corporate 10-year bonds and the corresponding Trezers; The situation in the corporate debt market remains stable.
Complete today's analysis of the review of the expected inflation and its speakers this week, as well as the S & P500 index situation:
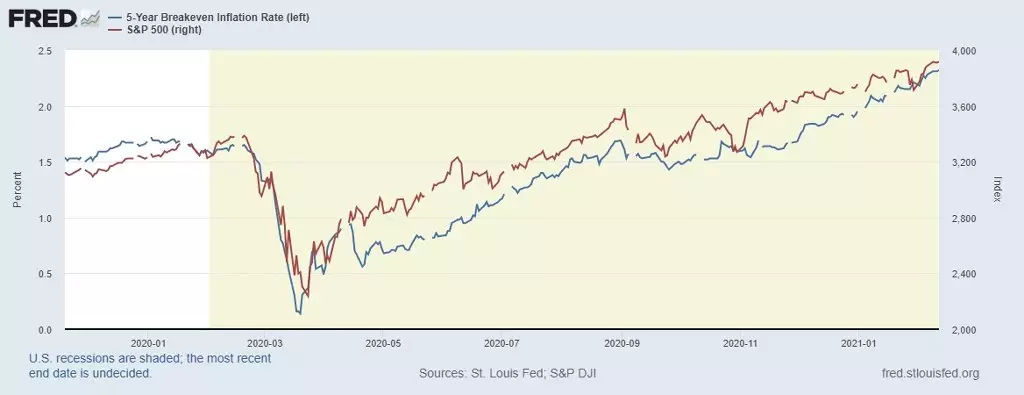
The blue line is the expected inflation: we see that the indicator continues to update the maxima. In my opinion, this is a response to the deepening surplus of the money market;
Red Line - Wide Market Quotes: The US stock market is entirely determined by reflation expectations. Taking into account the correlation of these indicators about the reversal of the stock market, it is not necessary to speak.
conclusions
The main conclusion: the current state of dollar liquidity indicators signals the monetary pressure on the US dollar on the entire week.
It is also worth paying attention to the growth rates of high-liquid money, which obviously provide support for food inflation and, apparently, create Fed problems already in the current year, since, in my opinion, the demand inflation after removing Lokdanov will begin to accelerate.
In general: so far the trends in the money market will continue, financial markets will continue to grow, in connection with which - carefully follow the rhetoric of members of the Fed. If the third package of help from the Biden administration is accepted, the markets will go further into growth, styled doping to failure.
Read Original Articles on: Investing.com